

Case Study: Allegheny Family Screening Tool
In August 2016, Allegheny County, Pennsylvania started running an algorithm over child welfare hotline calls and other government records, including Medicaid, mental health, jail, and probation histories. When someone calls the county hotline to report a child at risk, a screener types the details into the case management system and clicks a button. A score from 1 to 20 appears on screen, shaped like a thermometer. The screener and their supervisor then decide whether to send an investigator to the family's door.
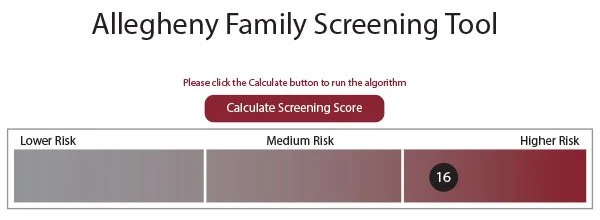
A screenshot from AFST
The call screening center took 15,768 referrals in 2017, of which 11,751 were the neglect allegations the tool scores. As of the county's August 2018 accounting, 34 people worked the phones as screeners and supervisors. A typical referral took 30 to 60 minutes to process.
The county ran a public procurement in 2014, hired two outside ethicists to review the model before it went live, and issued a second procurement at the end of 2015 to pay two separate research teams to evaluate it. It published the full development methodology eight months after launch. The independent impact evaluation, delivered by Stanford in 2019, found that the tool and the policy changes around it made screening decisions more accurate and narrowed the gap between how Black and white children were treated.
Six years later, the Justice Department's Civil Rights Division was asking questions about whether it discriminates against parents with disabilities.
One Tool, Several Models
Before anything else: "the Allegheny Family Screening Tool" names at least four different models. Version 1 launched in August 2016 and is the one nearly all the public numbers describe. Version 2 replaced it in November 2018. When the ACLU requested data in July 2021, the county sent weights for a further revision — the ACLU calls it V2.1 — and by the time the Justice Department got interested, the county was running a Version 3. The county told the Associated Press it "has updated its algorithm several times and has sometimes removed disabilities-related data points."
So the accuracy findings and the disability findings below are not two verdicts on the same object. Throughout the rest of this article, I will clarify which model is being discussed.
What the Tool Predicts, and Why That Choice Matters
AFST is a classifier. Models like this require an outcome, or a dependent variable. What is it trying to predict? In another model, that might be the identity of a photograph’s subject, whether a comment is against the rules or not, or which way the self-driving car should go. To train it well, the outcome variable needs to be in the training data set.
The higher the stakes of the model, the more important the selection of this outcome variable is.
It could not predict something like “will this child be abused?” because a lot of abuse goes unreported: the outcome variable would not be reliably in the training data. Version 1 predicted two things it could observe, both drawn from the county's own administrative records (county FAQ, p. 5):
If this call gets screened in for investigation, will a judge place this child in foster care within two years?
If this call gets screened out, will someone call about this child again within two years?
The county chose these two outcomes deliberately and explained why. Placement is ordered by a judge, with attorneys representing the parents, the child, and the county, so it isn't purely the agency's own decision reflected back at itself. Re-referral originates from the community rather than from staff. Later versions dropped the second outcome; the model the ACLU audited estimates only the probability of removal within two years.
The selection of the outcome variable, the quality of the outcome variable in the training data, and the social system surrounding the training data are of critical importance. Physician and researcher Ziad Obermeyer and colleagues showed why it matters in a 2019 Science paper examining a commercial algorithm used to enroll patients in extra care programs. That algorithm predicted future health care spending as a stand-in for future illness. Because less money gets spent on Black patients at any given level of sickness, the algorithm systematically rated Black patients as healthier than they were. At the same risk score, Black patients had more chronic conditions than white patients. Nobody wrote race into the model: the bias entered through the definition of the thing being predicted.
Allegheny's proxies are better reasoned than that one. They are still proxies. A judge's placement decision and a neighbor's second phone call are both influenced by who gets watched.
The Ingredients
Version 1's score drew on more than 100 factors using linked records from 21 county data systems. Those systems include child protective services, publicly funded mental health services, publicly funded drug and alcohol treatment, and bookings in the county jail.
Race is not one of the factors. The county tested it, found it did not improve accuracy, and left it out. The county's own FAQ explains that this doesn't settle the matter: criminal justice history and similar variables correlate with race "due to potentially institutionalized racial bias," so "continued monitoring of application of the model with regard to racial disparities should be undertaken."
The scores did come out higher for Black children. Through the end of 2017, 47% of Black children whose data was run the prediction model scored in the high range of 15 to 20, against 39% of white children. At the low end of 1 to 9, the numbers reversed: 18% of white children, 10% of Black children.
Two more design details worth noticing. First, the model scores each child on a referral separately, but the screener sees one number: the highest score in the household. A family with children scoring 5, 10, and 18 is a family that shows up on screen as an 18. Second, only the call screener and their supervisor can see that number. Investigators sent to the home cannot. Neither can the courts, the parents, or their attorneys.
Two Findings That Point in Opposite Directions
A Stanford team spent 18 months evaluating Version 1 and released results in May 2019. They compared roughly 34,000 children in neglect referrals during the 15 to 17 months after full implementation against roughly 31,000 children referred before it. They reported that the tool plus the accompanying policy changes improved the accuracy of screening decisions and reduced racial disparities in case openings. The mechanism was specific: cases opened for white children rose modestly, and the rate at which Black children were screened in fell (full evaluation). Investigator workload did not increase.
In April 2022 the Associated Press published an investigation raising racial bias and transparency concerns about the tool. Civil rights complaints followed that fall, and in January 2023 the AP reported that attorneys in the Justice Department's Civil Rights Division were examining it (PBS NewsHour carrying the AP report). The AP's March 2023 story went through the specific variables.
The substance of the complaint got worked out in a study (full text). Working from the V2.1 weights, they found the model includes features recording whether people on a referral have used county behavioral and mental health services: that could add up to three points to a child's score on the 20-point scale. They found that considering households together not only raised scores (which is necessarily the case) but also widened racial gaps. The study also noted that some variables that could reflect past conditions or temporary need, including whether they have at any time qualified for aid and whether they had ever stayed in county jail (regardless of the charge or whether they were convicted), constituted permanent markers for families. Juvenile probation data was also a permanent marker, and including it in the model increased the race gap without adding much predictive value.
These predictors "have the effect of casting permanent suspicion and offer no means of recourse for families marked by these indicators … They are forever seen as riskier to their children" (HRDAG summary).
Then they ran the counterfactual. They removed those features from the model and checked what happened to AUC, the accuracy measure the tool was built to maximize. The answer was: not much. The features that flagged families for using mental health care were carrying an equity cost and buying very little accuracy in return.
About That Accuracy Number
At rollout, Version 1's AUC for predicting placement was 0.70. AUC, or area under the curve, runs from 0.5 (coin flip) to 1.0 (perfect). Think of it as: hand the model one child who will be placed and one who won't; 0.70 means it ranks them correctly about 70% of the time.
The county originally published a higher figure, then corrected it downward. The correction came from the model's own developers: the training and test data had been split in a way that inflated the number. In a 2018 conference paper, they documented the fairness audit and the data problems they could not solve.
I want to pause here to point out that although the correction isn’t good news for the model itself, it is a good sign in a way. It is unusual for a model developer to publish a paper explaining that their headline accuracy figure was wrong, explaining the technical reason. They did not have to publish it, or even test it in the first place.
The Humans Did Not Behave the Way the Design Assumed
The tool marks some scores "mandatory screen-in." In the first full year, 63% of those referrals were actually screened in. Supervisors overrode the rest. At the other end, referrals with the lowest scores were screened in about 30% of the time.
Overall, the screen-in rate moved from 41.7% the prior year to 42.2% — half a percentage point.
Researchers later looked at which workers deviated from the score, in a 2022 paper. Senior staff were more likely to screen a case in, and they were also more likely to deviate from the algorithmically-suggested score.
This finding should worry anyone counting on human review as their primary safeguard. The humans who push back are the ones who built judgment before the tool arrived. As they retire, fewer algorithmically-generated scores are likely to be over-riden by human judgment..
Takeaways
Publish your numbers. Allegheny told the public that Black children were scoring higher, in writing, while the system was running. That is why we can have this argument at all. Compare that to the ordinary case, where a vendor's model is a trade secret and nobody outside can check anything.
Publishing does not buy you agreement. The county was transparent and still ended up under federal scrutiny. If your reason for transparency is that it will protect you from criticism, you have the wrong reason. Transparency lets other people find problems you missed, improving your outcomes.
Say which version you’re referring to. Allegheny published carefully and still ended up in a public argument where a 2019 accuracy finding about Version 1 was being weighed against a 2023 disability finding about Version 2.1. If you revise your model, publish the revision with the same care you published the original, and date everything.
Audit for every protected class, not just the obvious one. The county audited for race with outside ethicists, a published fairness analysis, and an independent evaluation. Disability slipped through, and it took a newsroom and an advocacy group to surface it. Ask which groups your data can even identify, then check each one.
Run the removal test. Take out the variables that worry you and re-measure accuracy. If performance barely moves, you have your answer and you did not have to weigh anything against anything.
Measure the tool the way you deploy it. Allegheny reported performance per child and deployed it per household. Those are different numbers, and the deployed one is worse. Whatever aggregation, rounding, or thresholding sits between your model's output and the screen a human looks at, evaluate the thing on the screen.
"A human makes the final call" is also testable. You can measure it. How often do your people override? Which people? Does that change as staff turn over?
Watch what you are actually predicting. Every one of these systems predicts something a database recorded, not the thing you care about. Write down the gap between the two in plain words and show it to someone who works the front line.
Questions Worth Asking About Your Own Decision Tools
If your organization uses a score, a rubric, or a model to help decide who gets served, investigated, prioritized, hired/fired, or denied:
What does the system actually predict, and how far is that from the harm you are trying to prevent?
Which of your data sources record contact with an institution rather than a condition: arrests, service enrollment, prior reports? Whose lives generate more of those records? What are those data points actually a reflection of, and is it always something meaningful?
What happens between the model's output and the number a person sees? Have you measured accuracy on that number, or only on the raw output?
Can you name a protected group your data identifies that you have never audited?
If you deleted a questionable variable, how much accuracy would you lose? Has anyone checked?
Who overrides the tool, how often, and what happens to that rate when your most experienced staff leave? How good are those override judgments?
Could a journalist reconstruct what your system does from what you have published? If not, who is checking it?
LLM disclosure: I used Claude to help me find a case study that I didn’t know existed! I had to fact-check and clarify a decent amount of the content, but the AFST was a rabbit hole I would never have gone down otherwise!